
Metrics (Preview)
Where Statistics gives you five fixed charts, the Metrics screen lets you build your own. You select the measures you need, set how each one is charted and how wide it sits, and arrange them into tabs that you return to.
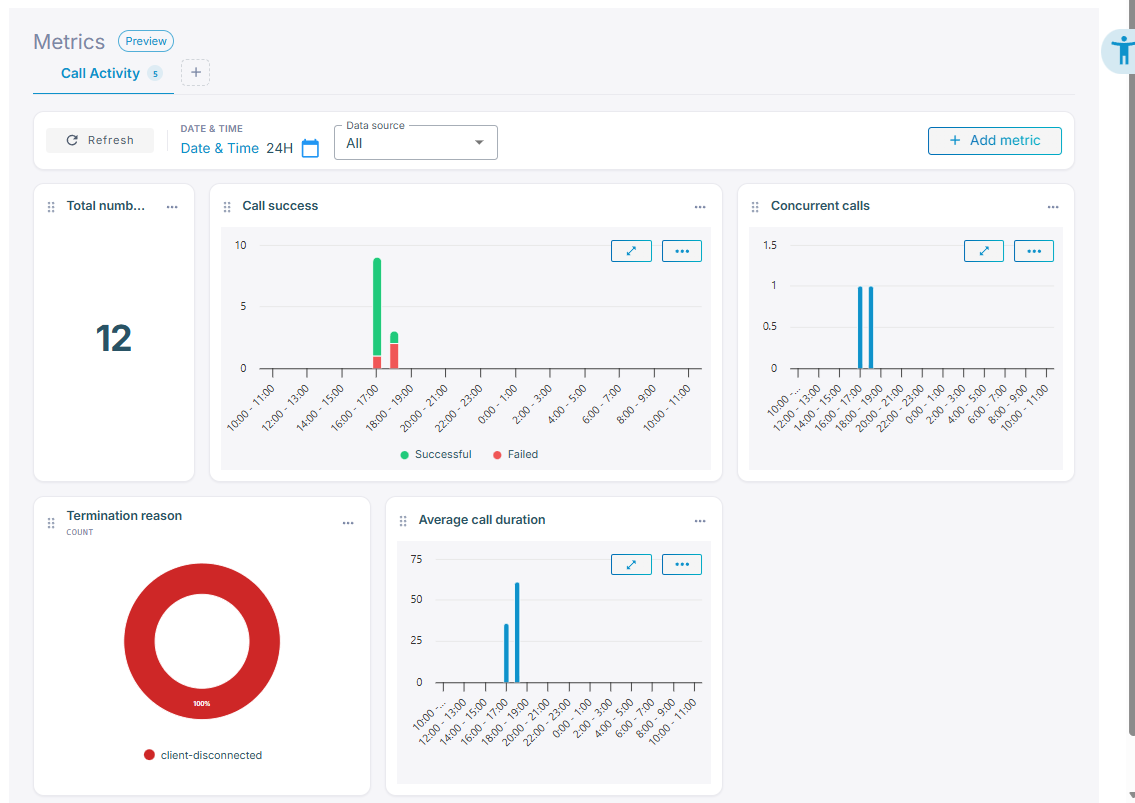
The catalogue draws on three sources:
- Call statistics — the same measures as the Statistics screen.
- Predefined metrics — collected by Live Hub during calls, including bot latency and LLM and tool activity.
- Insights — your own metrics, produced by post-call analysis, such as sentiment or escalation risk. An insight you create there appears here and behaves like any other metric.
Build a tab
Metrics live on tabs. A new account starts with Call Activity; you can add up to 10 tabs, each holding up to 50 metrics.
- Add a tab: Click the + beside the tab names. Select a tab to open it, double-click it to rename it, and drag it to reorder.
- Delete a tab: Click Delete tab, and then confirm. The tab and its metrics are deleted together. This is irreversible and cannot be undone.
To add a metric:
-
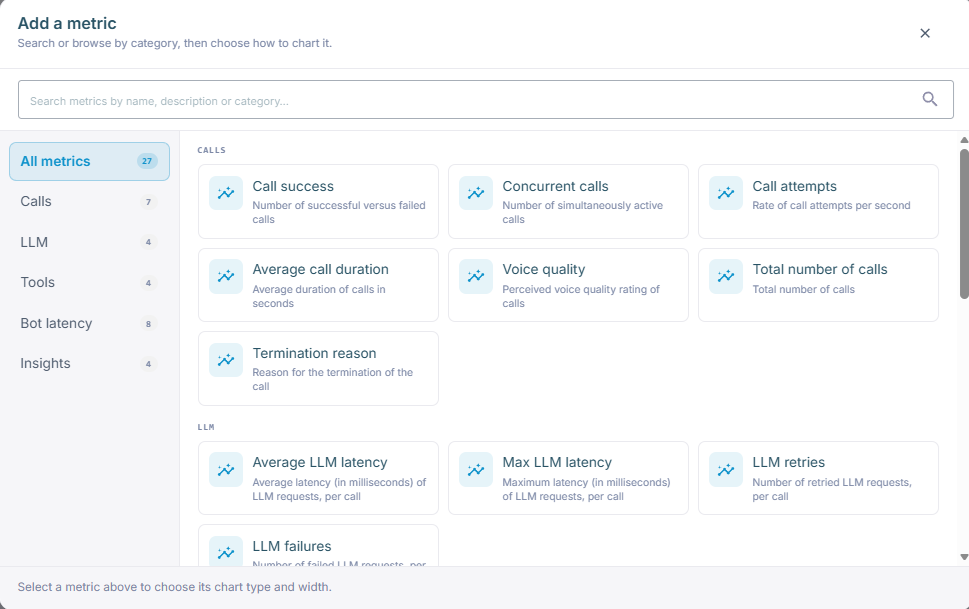
Click Add metric.
-
Find the metric: browse the categories Calls, LLM, Tools, Bot latency, and Insights, or search by name, description, or category.
-
Select it, and then set how it is drawn:

- 'Chart type' — Number, Bar, or Donut, depending on what suits the metric.
- 'Aggregation' — Average, Min, Max, Sum, or Count, where the metric supports it.
- 'Width' — how many of the tab's six columns the metric takes. Use Narrower and Wider.
-
Click Add metric.
Once a metric is on the tab, drag it to move it, drag its edge to resize it, and use its Metric options menu to open it full screen or Remove it. The layout is saved automatically.
Filter the metrics and open the calls behind them
Date & time sets the period, and 'Data source' narrows the metrics to one connection instead of the whole account. Administrators can also select the account. Click Refresh to reload the metrics.
Where a metric supports it, clicking through takes you to call history for the calls behind the figure. That is how you get from a rise in average duration on Tuesday to the calls that caused it.